Shortly after I graduated from University, I attended a series of personal finances seminars offered by my new employer. The evening seminars were given by a gentleman named Graydon Watters – a dynamic presenter and author of Financial Pursuits who I credit with providing me with my introduction to personal finance.
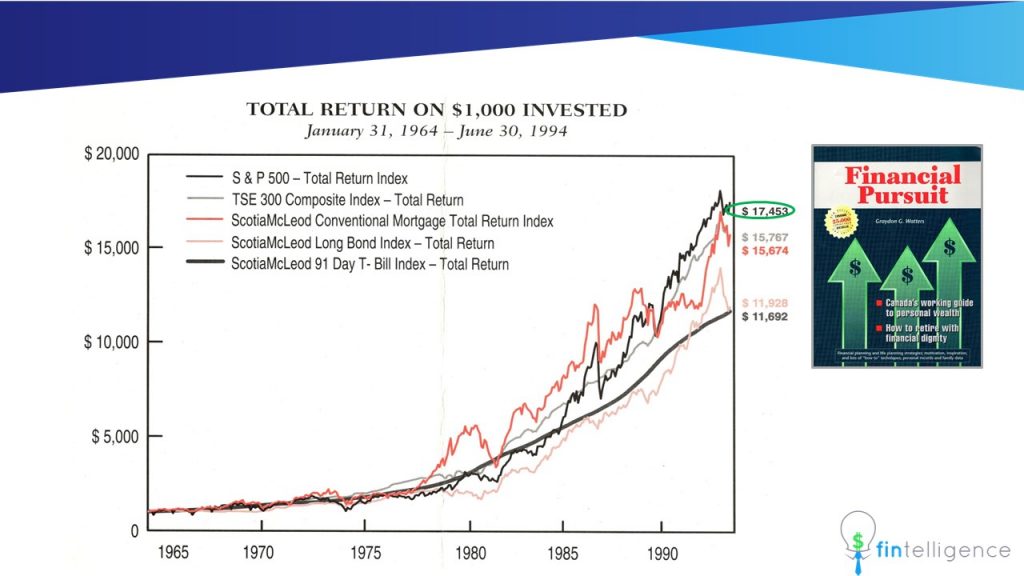
The first slide Mr. Watters put on the screen showed the following chart.

18x Money in 30 Years
It showed that if $1000 had been invested in the entire US stock market just before I was born, by the time I started my career, that money would have grown to almost $18,000. For a young engineer, this was exciting stuff. An eighteen times return on money in 30 years seemed compelling (Note: It represents a 10% annual compound rate of return)
What is the “US Stock Market”?
My first question, of course, was: What is the “US Market”? After a bit or research, I learned that the US Market is quite literally all of the stocks representing all US publicly traded companies. That is, if you added up every single share of every publicly traded company in the US (or any economy), the sum would be the “Market”.
Of course, to be practical, economists use slightly simpler measurements to represent the market. One such measurement is the S&P 500 Index – a single number formed by adding up the the approximately 500 largest companies in the US. At the time of writing, the S&P 500 Index is approximately 3,000. The S&P 500 Index is widely regarded as the best single gauge of the US large-cap (big) companies.
So, by looking at the movement of the S&P 500 Index, we can gauge if the market is “up” or if it is “down” on a particular day, week, month or year.
Its Easy to Buy the Entire US Stock Market
It turns out that it would have been quite difficult (impossible?) for most investors to buy the “Market” (S&P 500 Index) back in 1964. You’d literally have to purchase shares of all 500 companies in different amounts in a weighted average of each company’s size as represented by it total share price. Of course, even if you had managed to do this successfully, you’d have to buy and sell fractions of shares each day to keep up with movements in share prices (and thus the weighting of each company in the index as prices fluctuate each day).
Today, it’s extremely easy to invest in products called “index funds” that accurately track the S&P 500 (or many other market indices). The best news of all is that most index funds are extremely efficient and costs very little to own. Like stocks, most index funds can be purchased and sold on a stock exchange. This gives rise to the name “Exchange Traded Fund” – ETF for short. While not exactly the same, for our purposes, I’m going to use the term ETF to represent index funds.
While mutual funds charge anywhere between 1% to 3% per year to manage their baskets of stocks, many ETFs charge a small fraction of that – typically 0.05% to 0.20%. This is because ETFs do not have to pay fund managers and research departments or have massive marketing budgets. Its a spreadsheet and a computer algorithm that’s set up to track an index.
The chart below shows three of the most common (and lease expensive) ETFs available to Canadians that track the S&P 500 Index.
Over long periods of time, through market downs and ups, investing regularly (monthly) in any of these three ETFs will most likely yield performance that far exceeds any mutual fund.
Recent Comments